Configuring and operating a server
In the previous exercise we used a demo environment where an Egeria server was setup automatically by scripts that ran after you deployed the Helm chart. This provides a quick-start to understand more about Egeria, and be able to experiment with the API and interfaces more easily, but isn't representative of a typical deployment since the configuration is fixed.
In this session we are going to configure the servers via the Egeria platform's REST API.
Re-installing the simple demo environment
We are first going to clean up the Egeria environment you have already created:
$ helm list
NAME    NAMESPACE   REVISION    UPDATED                                 STATUS      CHART                           APP VERSION
base    default     1           2022-01-11 18:50:08.591645 +0000 UTC    deployed    egeria-base-3.4.1-prelease.3    3.4
$ helm delete base
release "base" uninstalled
$ kubectl get pods
No resources found in default namespace.
Now we'll install the same demo again, but this time we are going to set a parameter which prevents the servers being automatically configured, so that we can walk through this in the tutorial:
$ helm install base egeria/egeria-base  --set egeria.config=false
LAST DEPLOYED: Fri Jan  7 16:36:20 2022
NAMESPACE: default
STATUS: deployed
REVISION: 1
TEST SUITE: None
NOTES:
ODPi Egeria
---

Egeria base environment has now been deployed to Kubernetes.
It may take a minute or so for everything to start up.

Use 'helm show values egeria/egeria-base' if installed direct from repo to see all
configurable values

By default a single platform is created using the latest release of Egeria, with a single
metadata server 'mds1' and a view server 'view1'. The UI organization name is 'org'.
A job is started to perform this configuration and may take up to 10 minutes to complete.

Please provide any feeback via a github issue at https://github.com/odpi/egeria or
join us on slack via https://http://slack.lfaidata.foundation

- The ODPi Egeria team
Note
The explanatory note printed to the screen after installing the chart is fixed text, and does not take account of the additional configuration parameter we passed to skip the automatic configuration - which in this case has not been done.
As before, we must check everything is running ok before we continue, so repeat getting the status of the pods until all the pods are ready:
jonesn:~/ $ kubectl get pods                                                                                                           [16:38:23]
NAME                                       READY   STATUS    RESTARTS      AGE
egeria-base-presentation-d4c97645d-gm925   1/1     Running   0             2m12s
egeria-base-platform-0                     1/1     Running   0             2m12s
base-zookeeper-0                           1/1     Running   0             2m12s
base-kafka-0                               1/1     Running   1 (14s ago)   2m12s
Checking logs
All of the containers were are running above are configured to output regular log messages to stdout.
In order to view these logs from the command line with Kubernetes try commands such as:
$ kubectl logs egeria-base-platform-0
Starting the Java application using /opt/jboss/container/java/run/run-java.sh ...
INFO exec  java -XX:+UseParallelGC -XX:MinHeapFreeRatio=10 -XX:MaxHeapFreeRatio=20 -XX:GCTimeRatio=4 -XX:AdaptiveSizePolicyWeight=90 -XX:+ExitOnOutOfMemoryError -XX:MaxMetaspaceSize=1g -cp "." -jar /deployments/server/server-chassis-spring-3.4.jar
 Project Egeria - Open Metadata and Governance
    ____   __  ___ ___    ______   _____                                 ____   _         _     ___
   / __ \ /  |/  //   |  / ____/  / ___/ ___   ____ _   __ ___   ____   / _  \ / / __    / /  / _ /__   ____ _  _
  / / / // /|_/ // /| | / / __    \__ \ / _ \ / __/| | / // _ \ / __/  / /_/ // //   |  / _\ / /_ /  | /  _// || |
 / /_/ // /  / // ___ |/ /_/ /   ___/ //  __// /   | |/ //  __// /    /  __ // // /  \ / /_ /  _// / // /  / / / /
 \____//_/  /_//_/  |_|\____/   /____/ \___//_/    |___/ \___//_/    /_/    /_/ \__/\//___//_/   \__//_/  /_/ /_/

 :: Powered by Spring Boot (v2.5.6) ::

2022-01-07 16:36:41.046  INFO 1 --- [           main] o.s.b.w.embedded.tomcat.TomcatWebServer  : Tomcat initialized with port(s): 9443 (https)
2022-01-07 16:37:06.267  INFO 1 --- [           main] o.s.b.w.embedded.tomcat.TomcatWebServer  : Tomcat started on port(s): 9443 (https) with context path ''

Fri Jan 07 16:36:47 GMT 2022 No OMAG servers listed in startup configuration
Fri Jan 07 16:37:06 GMT 2022 OMAG server platform ready for more configuration
OMAG server platform ready for more configuration is a sign that the platform is ready.
You can take a look at the logs of the other containers if you get any issues.
Ensuring the local environment can connect to the necessary containers
From the above we know that Egeria, and other containers, are running successfully - and since they are deployed in the same Kubernetes environment, they will be able to communicate with each other.
However we need to make sure that we can connect to Egeria, and the UI, from the local environment. This is so that we can use Postman and a browser.
This is done by a technique known as port forwarding. We can target either pods or services - but here we chose the latter, mostly for simplicity as the names are more simple and stable.
So first, let's see what services we have:
$ kubectl get services
NAME                      TYPE        CLUSTER-IP      EXTERNAL-IP   PORT(S)                      AGE
kubernetes                ClusterIP   10.43.0.1       <none>        443/TCP                      2d2h
base-zookeeper-headless   ClusterIP   None            <none>        2181/TCP,2888/TCP,3888/TCP   28h
base-kafka-headless       ClusterIP   None            <none>        9092/TCP,9093/TCP            28h
base-zookeeper            ClusterIP   10.43.44.98     <none>        2181/TCP,2888/TCP,3888/TCP   28h
base-kafka                ClusterIP   10.43.43.204    <none>        9092/TCP                     28h
base-presentation         ClusterIP   10.43.73.94     <none>        8091/TCP                     28h
base-platform             ClusterIP   10.43.169.147   <none>        9443/TCP                     28h
We could query these further to see which pods they point to, but for now let's carry on and setup a port forward:
$ kubectl port-forward service/base-platform 9443:9443
Forwarding from 127.0.0.1:9443 -> 9443
Forwarding from [::1]:9443 -> 9443
You'll note that this command does not terminate. It is only forwarding data when it is running.
If you are using a *nix type shell, you could run in the background (add '&' to the invocation). Alternatively just run in a new window
We also want to do the same with the UI:
$ kubectl port-forward service/base-presentation 8091:8091
Forwarding from 127.0.0.1:8091 -> 8091
Forwarding from [::1]:8091 -> 8091
Configuring Egeria servers
Our starting point here is that we have 4 containers running:
- A single Egeria platform (egeria-base-platform-0 in the above example)
- A UI (egeria-base-presentation)
- Kafka (used to communicate between servers)
- Zookeeper (used by Kafka)
However we do not yet have any Egeria servers defined. We will do this later in this section.
Check the server platform is running ok
We've already checked that the local environment is ok, and we know the containers are running ok, so the next step is to issue REST calls to the Egeria platform to check it is working correctly.
Earlier in this session, you downloaded an application called Postman and loaded collections of pre-defined requests. This tool makes it easy to issue REST API requests to the OMAG Server Platform.
For the rest of this section, go to Postman and use the Egeria-platform-services collection.
Check that it is working by locating the Get Server Origin request,
When you click on that request in the left-hand list, a new tab opens and you can click on send to issue the request. Below is this response in Postman.
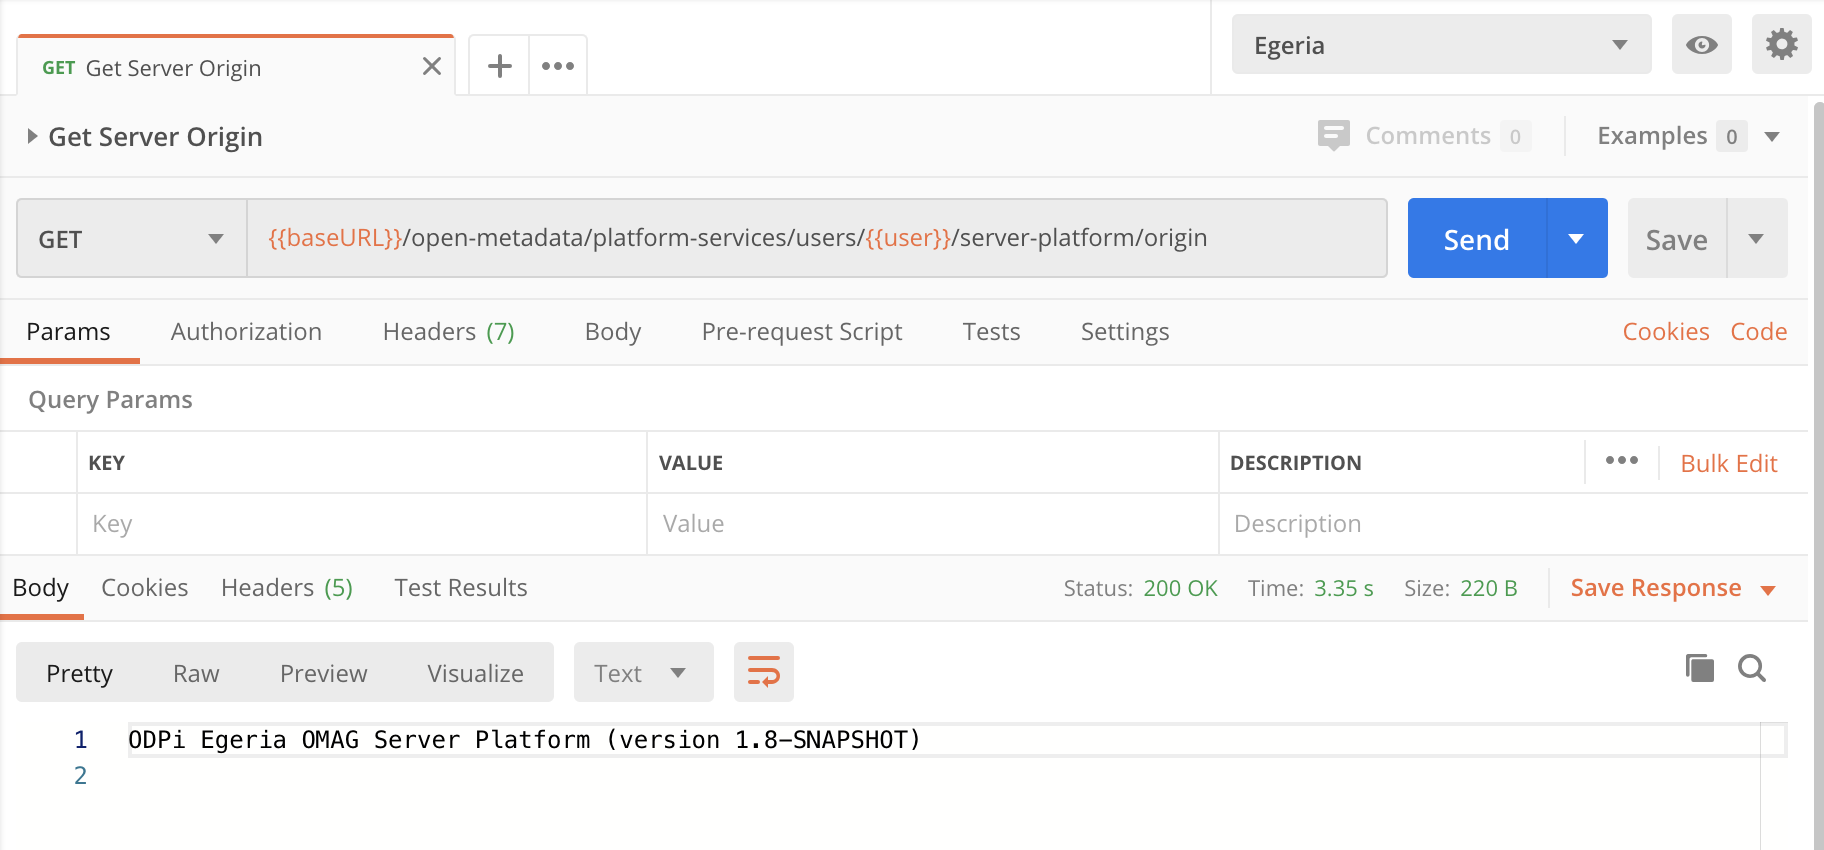
If this does not work, then there is something wrong either in Postman or your platform. Check the URL string that was used in the request (shown in orange in the middle of the screen.)
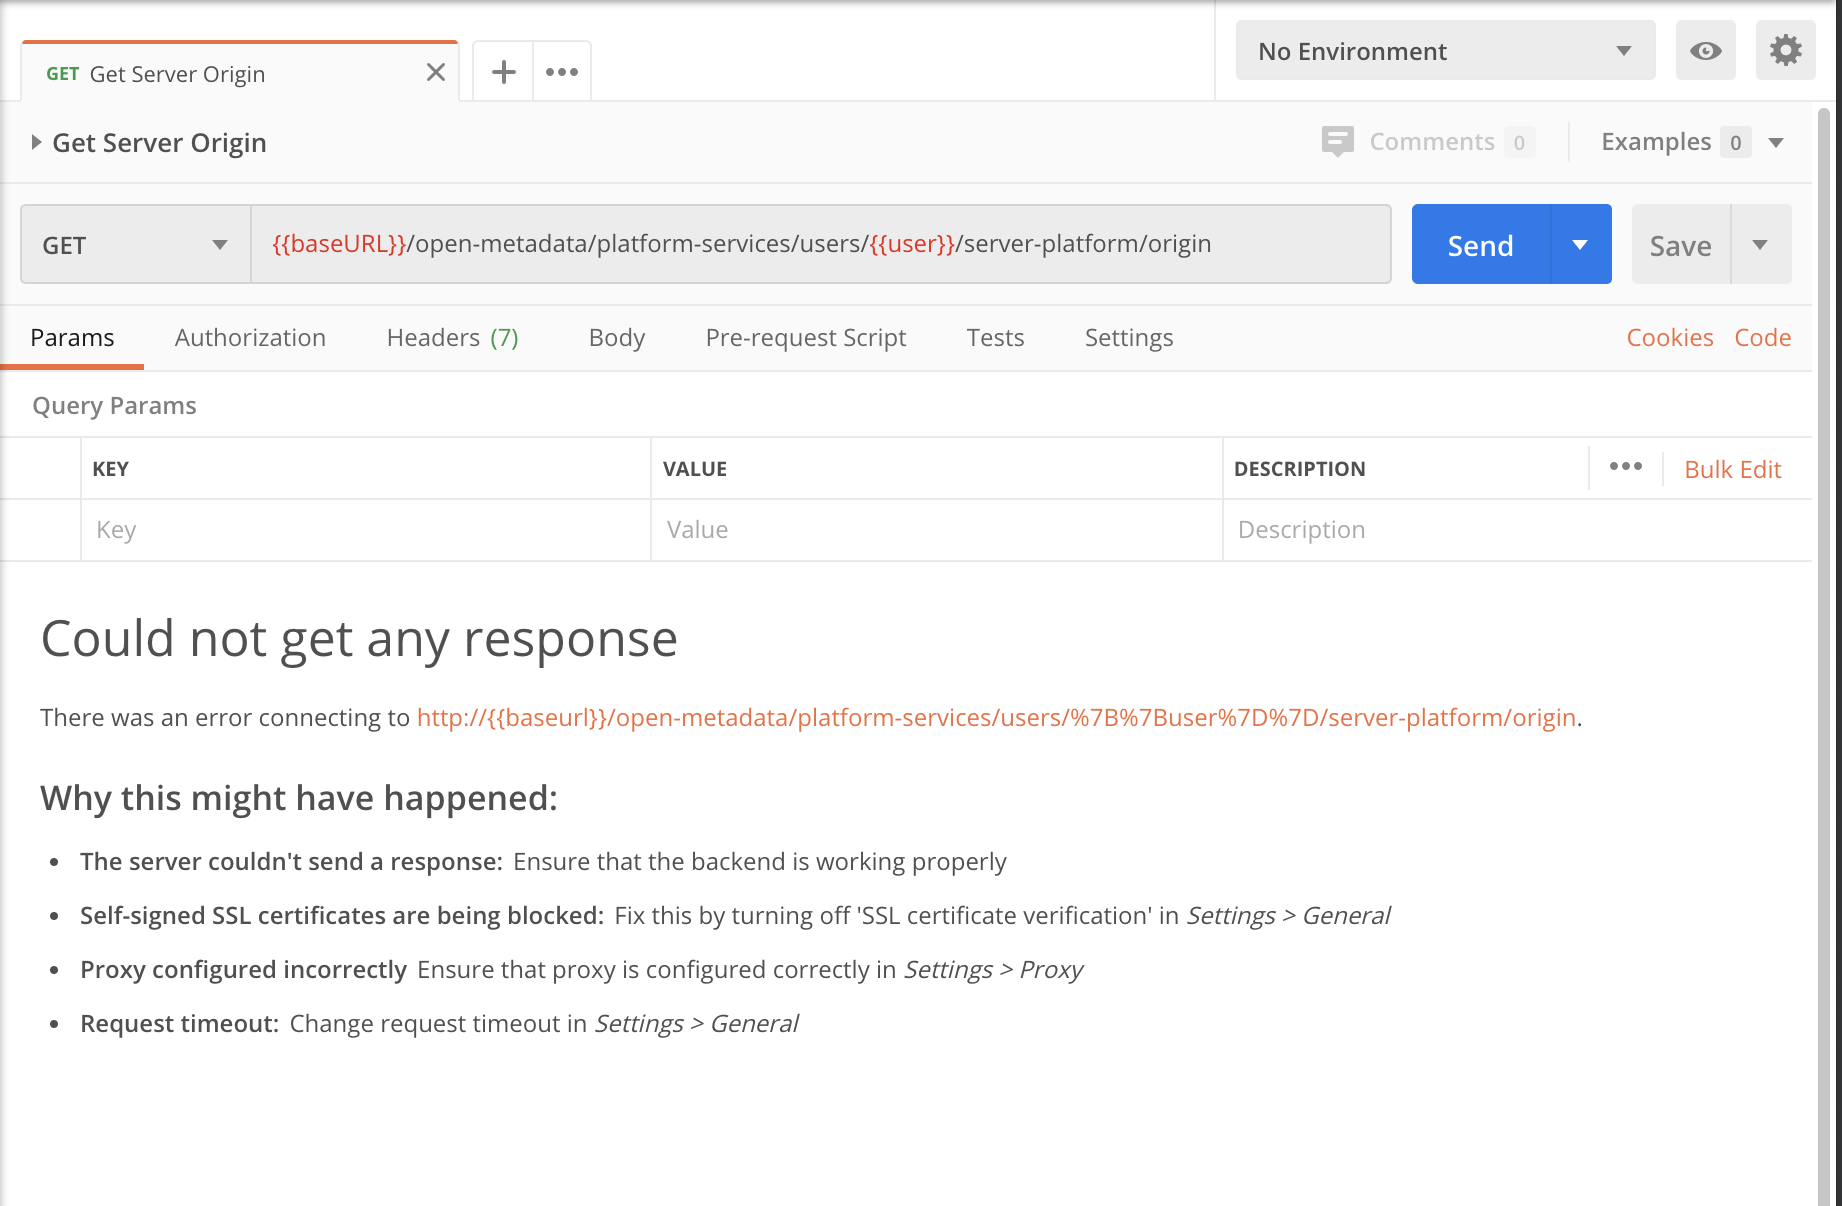
The screen shot below shows the error message when the egeria environment is not set. This can be fixed by setting it in the top right-hand dropdown. If the Egeria environment is not listed then you need to load the environment (Postman tutorial ).
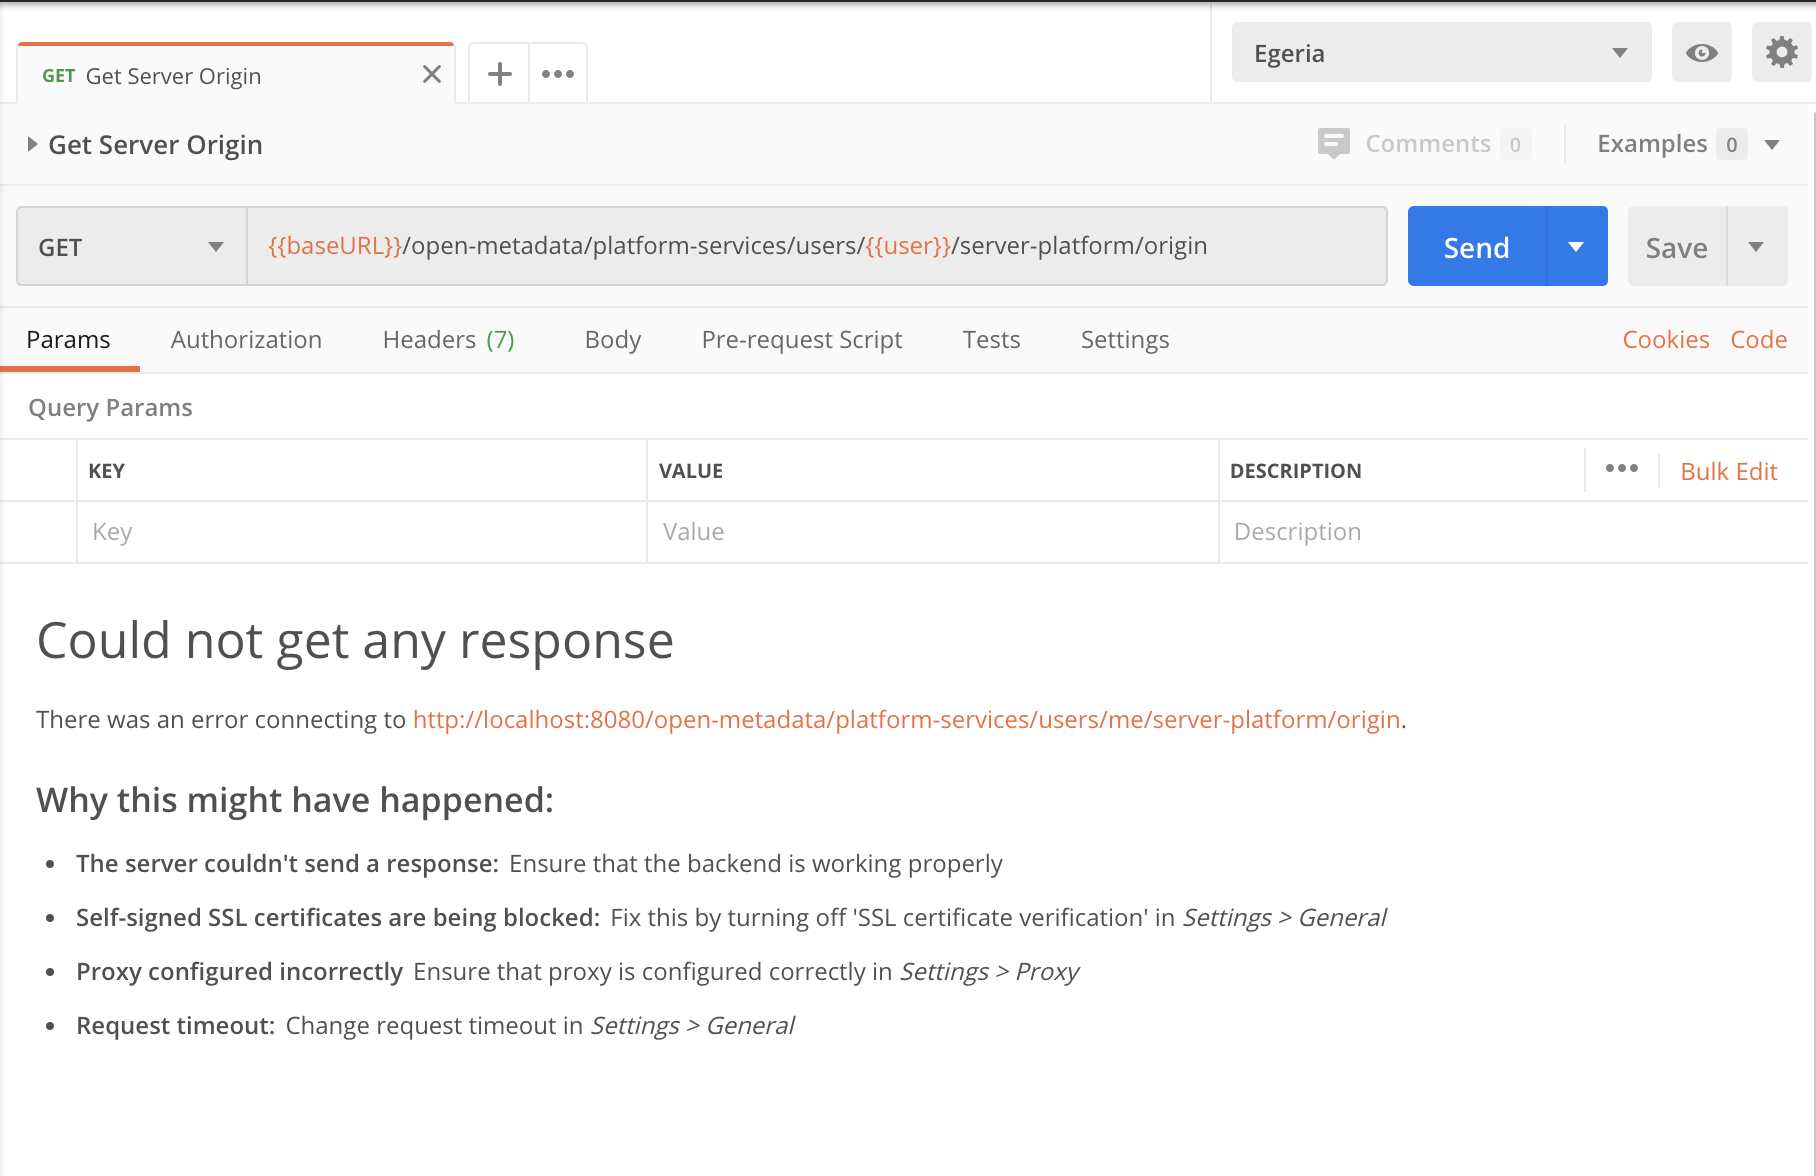
If the baseURL variable is set to a different value to the server platform then Postman can not connect.
In the screen capture below, you can see the baseURL is set to the default of https://localhost:9443 - you will need to correct this if wrong
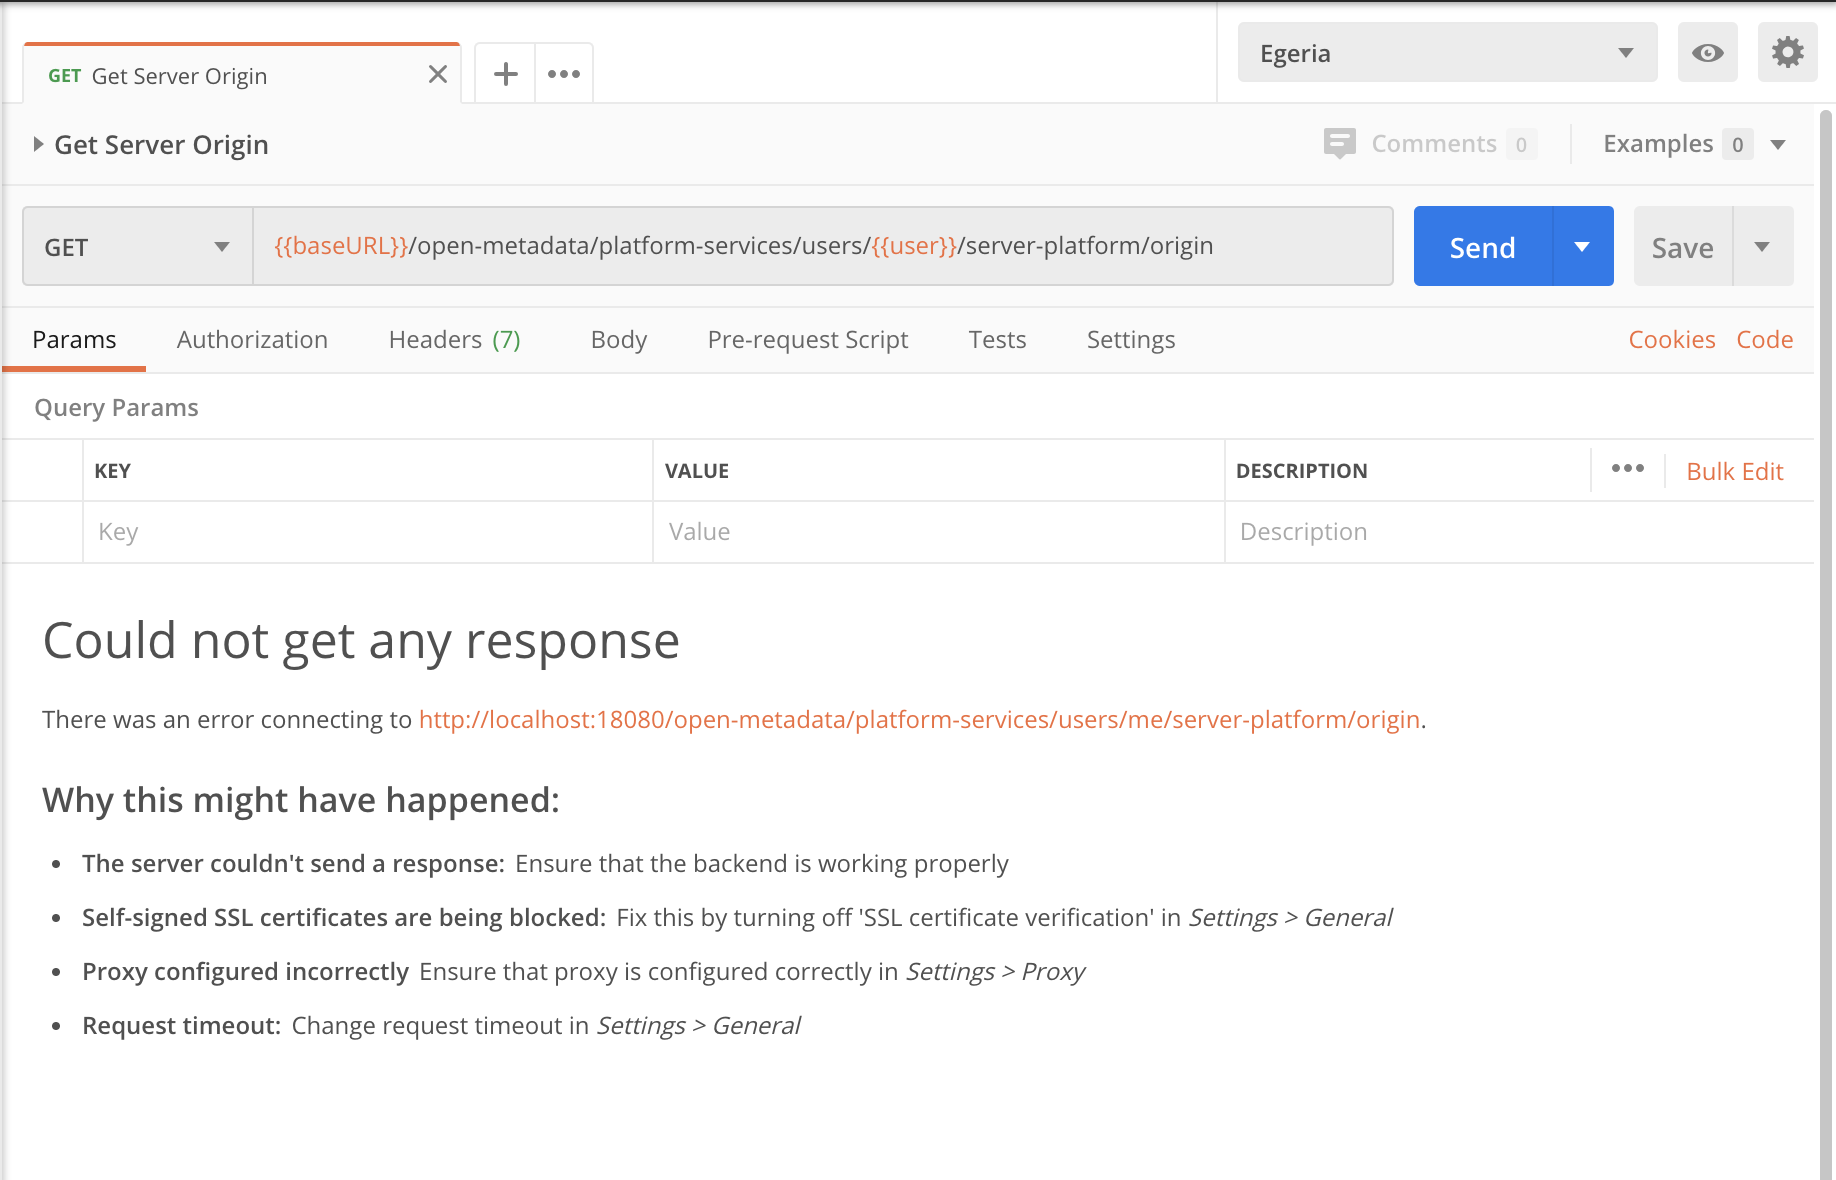
Finally, if the OMAG Server Platform is not running the even though everything is set up correctly in Postman, it has nothing to connect to. Go back to the helm chart deployment earlier and check this completed successfully.
Configuring a metadata server using the REST API
In last part of this session you will learn how to set up the OMAG Server Platform so that it is secure and determine the services and servers that are associated with the platform. Information on how to do this is found in Configuring the OMAG Server Platform .
You can choose to type the request into Postman, or use the requests already defined in the
Egeria-admin-services-platform-configuration Postman collection.
The OMAG Server Platform is able to host one-to-many OMAG servers. An OMAG Server is responsible for supporting the integration of different types of technology. There are different types of OMAG Servers in Egeria. In this session you are going to learn how to set up particular type of OMAG server called a metadata server.
Begin by understanding about the different types of OMAG Servers and what they are used for by following the link below:
In this first exercise you are going to use Postman to configure a simple metadata server called
myMetadataServer.
Refer to Admin services user guide on metadata access servers for further information on the requests you will need to use.
Update environment
- In the Postman Egeria Environment, update the variable called
serverfrommyservertomyMetadataServer. As a reminder, the environment can be modified by ensuring the 'Egeria' environment is selected, then clicking on the 'eye' icon towards the top right of the Postman UI.
issuing REST calls to configure the server
Using the Egeria-admin-services-server-configuration Postman collection and the instructions
from the
create the configuration for myMetadataServer as follows. For each value, find the right REST API request in the
Postman collection. Then look at where the values come from. Sometimes you will need to change the variable
value in the Egeria Environment, sometimes you can type it directly into the request URL and other times,
the request in Postman is just what you need.
Each time you add a configuration value, retrieve the server's configuration to see how the effect of your requests are changing the server's configuration.
- Set local server URL root to
https://localhost:9443
This call is located in folder Configuring OMAG Servers/Configuration for Cohort Members/Configuring defaults for the Cohort Members/Set local server URL root.
The specific documentation for this call is in the Admin Guide here .
- Set localServerType to
Egeria Dojo Metadata Server(update the value in the request)
This call is located in folder Configuring OMAG Servers/Basic configuration for all types of OMAG Servers/Set local server type name.
The specific documentation for this call is in the Admin Guide here .
- Set organizationName to your organization name (update the variable
organization_name).
This call is located in folder Configuring OMAG Servers/Basic configuration for all types of OMAG Servers/Set Organization name.
The specific documentation for this call is in the Admin Guide here .
- Set localServerUserId to
myMetadataServerUserId.
This call is located in folder Configuring OMAG Servers/Basic configuration for all types of OMAG Servers/Set local server user Id.
The specific documentation for this call is in the Admin Guide here .
- Set localServerPassword to
myMetadataServerPassword
This call is located in folder Configuring OMAG Servers/Basic configuration for all types of OMAG Servers/Set local server user password.
The specific documentation for this call is in the Admin Guide here .
- Set maxPageSize - the maximum page size that can be set on requests to the server. The default value is 1000.
This call is located in folder Configuring OMAG Servers/Basic configuration for all types of OMAG Servers//Set max page size.
The specific documentation for this call is in the Admin Guide here .
- Add a graph-based local repository. This will store metadata in JanusGraph .
This call is located in folder Configuring OMAG Servers/Configuration for Cohort Members/Configuration for Metadata Access Points/Configuration for Metadata Servers/Enable the graph repository.
The specific documentation for this call is in the Admin Guide here .
- Configure the Asset Owner Open Metadata Access Service (OMAS). URL name for this service is
asset-owner.
This call is located in folder Configuring OMAG Servers/Configuration for Cohort Members/Configuration for Metadata Access Points/Enable a specific access service.
The specific documentation for this call is in the Admin Guide here .
- Set up the Coco Pharmaceutical Server Security connector to provide authorization checks for inbound REST API calls.
This call is located in folder Configuring OMAG Servers/Basic configuration for all types of OMAG Servers/Set Server Security Connection.
The specific documentation for this call is in the Admin Guide here .
This completes the example configuration.
It's important to note that we are only defining the configuration of a server now. We are not starting it.
Examining the configuration
Use the Egeria-admin-services-platform-configuration Postman collection to experiment with the different registered services and known and active server requests. These are useful to know as we move to configure servers on the platform.
Test yourself
- What is the name of the place where a server's configuration is assembled?
- What determines where the server configuration is stored?
- What is the quickest way to discover what has recently changed in a server's configuration?
Starting an Egeria Server
In this section, you will learn how to start a server on the Open Metadata and Governance (OMAG) Server Platform. There are also optional advanced exercises in this session.
Using Postman, and the Egeria-admin-services-operational Postman collection, start your server myMetadataServer.
The documentation from the Admin Guide is shown below.
Review the logs to see typical output from the server being started.
Calling the metadata server API
We will now issue some of the API calls that are possible on the metadata server.
For this exercise, you will be using the following Postman collections:
Egeria-repository-services-local-repositoryEgeria-asset-owner-omas
The aim is to show the differences between the fine-grained repository services APIs and the course-grained, but more specialized, access services APIs.
Start with the the Asset Owner OMAS interface and add a CSV file. This returns a list of assets it has created, one for the directory and one for the filename. Retrieve these assets using the repository service API to see how these assets are stored.
What are the differences?
Later on today, you will have a chance to work with the Open Metadata Labs that provide a lot more explanation on the APIs and their differences. The purpose of this exercise was to giver you direct experience of the REST APIs.
Creating two servers
Metadata servers can exchange metadata via open metadata repository cohorts. In this session you will learn how to connect two servers via a cohort. But first you need to create a second server.
Using what you learnt earlier in this section, repeat the previous server configuration exercise twice - once to create a server called server1 and again to create a server called server 2.
Connect the Servers via a Cohort
Once you have 2 servers configured, add configuration to each of them to connect them via a cohort.
First read about Open Metadata Repository Cohorts .
Then
- Set up the event bus defaults
- Connect then together by adding cohort configuration to each server.
Start both servers and view their logs via Kubernetes - you should see that they are communicating.
Now use the commands in the Egeria-repository-services-metadata-highway to query information about
the cohort from each server's perspective.
Using the ecosystem UI
We will not explore the UI in this tutorial. we'll get into more detail on this configuration for your own deployments in a future dojo session.
Next step
Let's move on to Coco Pharmacueticals
Raise an issue or comment below