Operations Guide
The operations guide describes how to look after a running Egeria deployment: checking that the OMAG Server Platforms and their OMAG Servers are healthy, starting and stopping servers, loading new content, and running and tuning the connectors that do Egeria's work in the background.
It assumes the servers are already configured. Watching the deployment over time, tuning the infrastructure Egeria depends on (Apache Kafka and PostgreSQL) and routine maintenance such as backups are covered in the Monitoring and Tuning Guide. When something has gone wrong, turn to the Diagnostic Guide.
Ways to operate Egeria
When Egeria was first released, its REST APIs were the only way to control it. There are now four, and they all end up calling the same services, so you can mix them freely - for example, watching connector status in the portal while scripting a bulk change in Python.
| Option | Best for | What it offers |
|---|---|---|
| Egeria Operations (portal) | Day-to-day checks by an operator | A web view of servers, integration connectors, governance engines and engine actions, with simple actions such as start/stop, refresh, restart and cancel. |
| hey_egeria (command line) | Operators working in a terminal | Live monitors that update in place, plus tell commands to start/stop servers, refresh and restart connectors, manage catalog targets and load archives. |
| pyegeria (Python and Jupyter) | Automation and repeatable procedures | The full operational API as Python classes, so procedures can be scripted, scheduled, or written up as Jupyter notebooks that mix explanation with live results. |
| REST APIs | Integration with other tools, and anything the other options do not yet cover | The underlying services. The Runtime Manager view service is the recommended entry point. |
flowchart LR
    portal["`**Egeria Operations**
    portal`"] --> vs
    hey["`**hey_egeria**
    commands`"] --> py
    nb["`**Jupyter
    notebooks**`"] --> py
    py["`**pyegeria**`"] --> vs
    rest["`**Your own tools**
    REST calls`"] --> vs
    subgraph platform ["OMAG Server Platform(s)"]
    vs["`**View Server**
    Runtime Manager
    Automated Curation
    Asset Maker`"] --> mas["Metadata Access Store"]
    vs --> id["Integration Daemon"]
    vs --> eh["Engine Host"]
    end
All four routes go through a view server, which looks up the catalog entries for the platforms and servers and makes the calls on your behalf. This means operators only need access to the view server, not to every platform in the deployment, and every request is subject to the same security checks. The older platform services calls described in REST APIs go directly to a platform and are mainly useful in scripts that check whether a platform has started.
Which servers am I running?
The quickstart and freshstart deployments in egeria-workspaces run one platform hosting qs-metadata-store (a metadata access store), qs-view-server, qs-integration-daemon, qs-engine-host and qs-nanny-daemon (an integration daemon running the nanny connectors that maintain Egeria's own operational metadata). The examples in this guide use these names.
Egeria Operations in the portal
Egeria Operations is the runtime control panel on Egeria's portal. Open it from its tile on the portal home page, or go directly to /egeria-operations on the portal's address. It shows the state of the runtime itself rather than the metadata it holds; for the catalog entries describing the same servers, use the Open in The Catalog button on a server's detail panel.


Figure 1: Tabs of Egeria Operations
| Tab | What it shows | Actions |
|---|---|---|
| Servers | Every server on the selected platform, with its type, description, organization and status. Selecting a server opens a detail panel with its server identifier, services, maximum page size, repository connectors and local metadata collection identifier. | Start or stop a server (where your security permits). |
| Integration Connectors | The connectors in the selected integration daemon, filtered by integration group, name or status, with each connector's status, last status change, last refresh, refresh interval (minutes) and errors. The detail panel lists the connector's catalog targets and properties. | Restart or refresh a connector. |
| Governance Engines | The governance engines in the selected engine host, filtered by name or status, with each engine's type, service, description, status, request types and last refresh. | Start or stop the engine host; refresh an engine's configuration. |
| Engine Actions | The ecosystem-wide log of engine actions, filtered by status or searched by name, type or engine, with each action's request type, status, engine, requester, start and completion times and completion guards. Rows can be grouped by action name. | Cancel an engine action that has not finished. |
Each tab has a Refresh button and an auto setting that refreshes the view at a chosen interval. The Catalog link on a detail panel opens the catalog entry for the same server, connector, engine or action in The Catalog.
Why the Integration Connectors tab can show a stale banner
Connector status comes from the integration daemon's report, which asks every connector for its current state and can take minutes on a busy daemon. Rather than block, the tab shows the last report it has, under an amber banner ("Showing cached data - live status is refreshing in the background"), and updates itself when the fresh report arrives - usually within a minute. This is expected behaviour, not a hang.
Usage
Use Egeria Operations for the routine question "is everything running?", and for one-off actions such as restarting a failed connector. Changes that should survive a server restart - a new catalog target, a different refresh interval - are made to the connector's open metadata, as described in Running and tuning integration connectors.
hey_egeria commands
hey_egeria is the command line interface installed with pyegeria. Operational commands live under hey_egeria_ops (also reachable as hey_egeria ops) and come in two groups: show commands display information, and tell commands make changes. Many of the show commands are monitors: they redraw in place every few seconds until you press Ctrl-C, so they can be left running in a terminal window as a simple dashboard.
pip install pyegeria
The commands find the platform, servers and user from environment variables (such as EGERIA_VIEW_SERVER, EGERIA_VIEW_SERVER_URL, EGERIA_INTEGRATION_DAEMON and EGERIA_USER) or from options on the command line - run any command with --help to see them. hey_egeria tui opens a menu-driven builder that is the easiest way to discover the commands.

Figure 2: Building an operations command with
hey_egeria tui
Show commands
| Command | What it displays |
|---|---|
hey_egeria_ops show platforms status |
The platforms known to the view server and the servers on each. Also available as the stand-alone monitor_platform_status. |
hey_egeria_ops show servers status |
The status of the servers on a platform; add --full for more detail. Also monitor_server_status. |
hey_egeria_ops show servers startup |
Server start-up progress - useful straight after a platform restart. Also monitor_server_startup. |
hey_egeria_ops show integrations status |
Each integration connector in the integration daemon, with its status, last refresh time and refresh interval. --list produces a paged list instead of a live monitor. Also monitor_daemon_status / list_daemon_status. |
hey_egeria_ops show engines status |
The governance engines in the engine host and their status. Also monitor_engine_status / list_engine_status. |
hey_egeria_ops show engines current-activity |
The engine actions currently in progress. Also monitor_active_engine_activity. |
monitor_engine_activity / list_engine_activity |
All engine actions, including completed ones. |
list_catalog_targets |
The catalog targets of an integration connector. |
hey_egeria_ops show repository archives |
The open metadata archives loaded into the metadata access store. Also list_archives. |
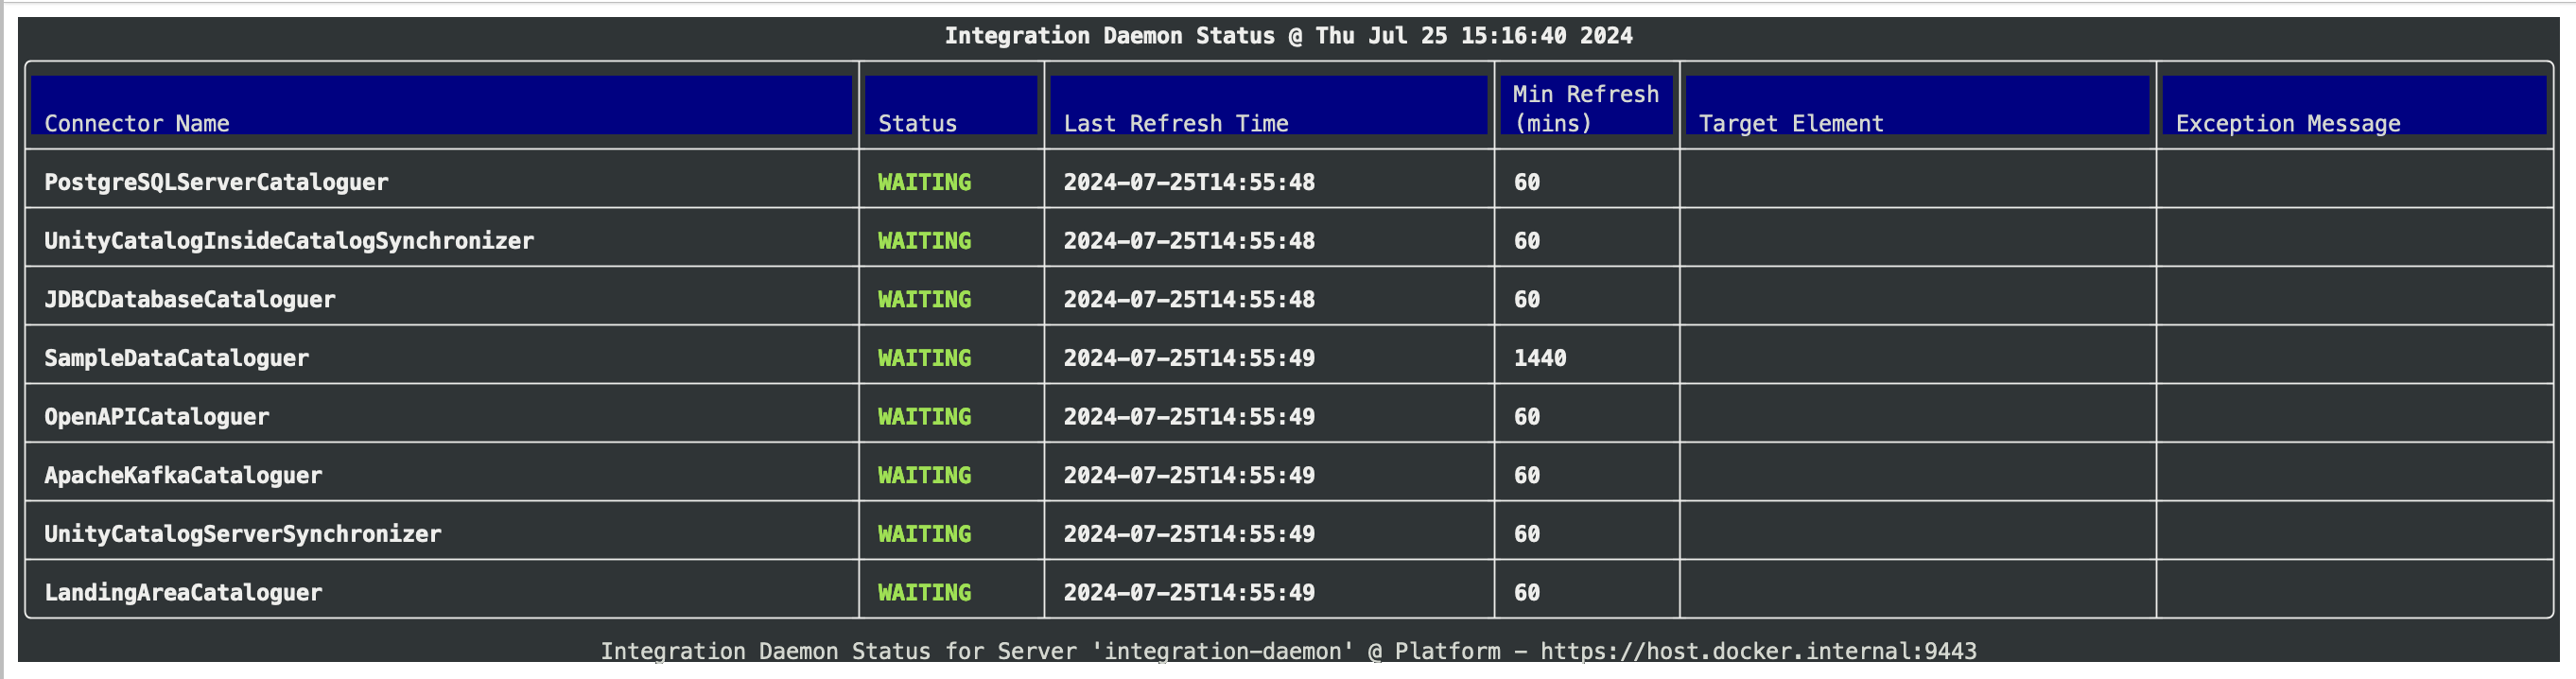
Figure 3: The integration daemon status monitor
Tell commands
| Command | What it does |
|---|---|
hey_egeria_ops tell servers start --server <name> |
Activates a server from its stored configuration. |
hey_egeria_ops tell servers stop --server <name> |
Shuts a server down. |
hey_egeria_ops tell integration-daemon refresh [--connector <name>] |
Calls refresh() on one connector, or all of them. Also refresh_integration_daemon. |
hey_egeria_ops tell integration-daemon restart [--connector <name>] |
Disconnects and restarts one connector, or all of them. Also restart_integration_daemon. |
hey_egeria_ops tell integration-daemon add-target <connector-name> <element-guid> <catalog-target-name> |
Adds a catalog target to an integration connector. |
hey_egeria_ops tell integration-daemon update-target <relationship-guid> <catalog-target-name> |
Changes the name of an existing catalog target. |
hey_egeria_ops tell integration-daemon remove-target <relationship-guid> |
Removes a catalog target. |
hey_egeria_ops tell engine-host refresh |
Asks the engine host to reload its governance engine configuration. Also refresh_gov_eng_config. |
hey_egeria_ops tell repository load-archive |
Loads an open metadata archive (such as a content pack) into the metadata access store. Also load_archive. |
The full command reference, with a screenshot of each display, is in the hey_egeria documentation .
pyegeria scripts and Jupyter notebooks
pyegeria wraps Egeria's REST APIs in Python classes. The ones used for operations are:
| Class | Use it for |
|---|---|
RuntimeManager |
Platform and server status reports, starting and stopping servers, loading archives, cohort membership, and controlling integration connectors and governance engines. |
AssetMaker |
Maintaining the open metadata that describes integration connectors: catalog targets and their registration in integration groups. |
AutomatedCuration |
Engine actions, governance action processes and technology types. |
EgeriaTech |
All of the technical clients in one object, created as each one is first used. |
A short script can check a server and refresh a connector:
from pyegeria import RuntimeManager

rm = RuntimeManager("qs-view-server", "https://localhost:9443", user_id="garygeeke", user_pwd="secret")
rm.create_egeria_bearer_token()

# How is the integration daemon doing?
print(rm.get_server_report(server_name="qs-integration-daemon"))

# Refresh one connector (omit connector_name to refresh them all)
rm.refresh_integration_connector(connector_name="MSSQLServerCataloguer",
                                 display_name="qs-integration-daemon")

rm.close_session()
Servers can be identified by server_guid, display_name or qualified_name, so scripts do not need to look up GUIDs first. Most report methods take an output_format ("JSON", "DICT", "MD", "TABLE" and others) so the same call can feed another program or produce a readable report.
The same code runs in a Jupyter notebook, which is a good way to capture an operational procedure: each step is explained in a markdown cell, and its live result appears underneath. The egeria-workspaces deployments include a Jupyter server with sample notebooks.
Usage
Script anything you do more than twice - rolling out a catalog target to a set of databases, checking every connector after an upgrade, restarting servers in a particular order. The hey_egeria commands are themselves pyegeria scripts, so their source is a good place to find working examples.
REST APIs
Every operation above is available as a REST call.
- The Runtime Manager view service covers platforms, servers, cohorts, archives, integration connectors and governance engines. Calls go to the view server, which forwards them to the right platform. Sample requests are in Egeria-api-runtime-manager.http .
- Asset Maker maintains the catalog targets and integration group registrations that drive the integration daemons.
- Automated Curation lists, starts and cancels engine actions.
- The platform services go directly to one platform. They need no view server, which makes them the right choice for start-up scripts that wait for a platform to come up. See Server Platform Origin Service, Starting and Stopping an OMAG Server and Adding an Archive to a Running Server.
All calls carry a bearer token obtained from the platform's token service:
###
# @name Token
POST {{baseURL}}/api/token
Content-Type: application/json

{
  "userId" : "garygeeke",
  "password" : "secret"
}
For example, this call activates a server from its stored configuration:
###
# @name activateWithStoredConfig
POST {{baseURL}}/servers/{{viewServer}}/api/open-metadata/runtime-manager/omag-servers/{{serverGUID}}/instance
Authorization: Bearer {{token}}
Operating servers
Start, stop and check a server
A server runs from its configuration document and can be started and stopped any number of times without changing it.
| Task | Portal | hey_egeria | pyegeria (RuntimeManager) |
Runtime Manager REST |
|---|---|---|---|---|
| Is it running? | Servers tab | show servers status |
get_server_report() |
GET .../omag-servers/{serverGUID}/instance/report |
| Start | Servers tab | tell servers start |
activate_server_with_stored_config() |
POST .../omag-servers/{serverGUID}/instance |
| Stop | Servers tab | tell servers stop |
shutdown_server() |
DELETE .../omag-servers/{serverGUID}/instance |
| Stop and remove from its cohorts | - | - | shutdown_and_unregister_server() |
DELETE .../omag-servers/{serverGUID} |
Only stop and unregister a server that is being permanently removed: it tells the other members of each cohort to forget it.
Load new content into a metadata access store
Open metadata archives, including the content packs, can be loaded into a running metadata access store without a restart. Loading an archive a second time does no harm: an element is only added if the repository does not already hold it (or a later version of it).
| Option | How |
|---|---|
| hey_egeria | hey_egeria_ops tell repository load-archive |
| pyegeria | RuntimeManager.add_archive_file() for a file on the platform's file system, or add_archive_content() to send the archive in the request. |
| REST | POST .../omag-servers/{serverGUID}/instance/load/open-metadata-archives/file - see also Egeria-load-content-packs.http . |
Cohort membership
A server that is a cohort member can be connected to, disconnected from and unregistered from each cohort while it runs. Disconnecting stops the exchange but keeps the registration, so the server rejoins cleanly later; unregistering removes it from the cohort registry. Use RuntimeManager.connect_to_cohort(), disconnect_from_cohort() and unregister_from_cohort(), or the matching .../cohort-members/{serverGUID}/cohorts/{cohortName}/... REST calls.
Running and tuning integration connectors
An integration daemon runs integration connectors that keep open metadata in step with third party technologies. What a daemon runs is not in its configuration document: the document names one or more integration groups, and the integration groups, connectors and their settings are held as open metadata in the metadata access store. So most tuning is done by changing metadata, and the daemon picks the change up while it runs.
flowchart LR
    ID["`**Integration Daemon**
    configured with
    integration group names`"] -.->|reads| IG
    IG["`**IntegrationGroup**`"] -->|"`**RegisteredIntegrationConnector**
    connectorName, refreshTimeInterval,
    startDate, stopDate,
    permittedSynchronization ...`"| IC["`**IntegrationConnector**`"]
    IC -->|ConnectionToAsset| CN["`**Connection**
    connector type,
    configurationProperties`"]
    IC -->|"`**CatalogTarget**
    catalogTargetName,
    configurationProperties,
    templates ...`"| A1["`**Asset**
    e.g. a database server`"]
    IC -->|CatalogTarget| A2["`**Asset**
    another database server`"]
Figure 4: The open metadata that controls an integration connector
Connector status
The integration daemon reports a status for each connector. This is what the portal, show integrations status and the server report display:
| Status | Meaning | What to do |
|---|---|---|
INITIALIZED |
Set up and waiting to start. | Nothing - it moves on once started. |
WAITING |
Running normally, waiting for its next refresh. | Nothing. |
REFRESHING |
Its refresh() method is running. |
Nothing, unless it stays here for much longer than usual. |
RUNNING |
Running in its own thread (connectors that make blocking calls). | Nothing. |
STOPPED |
Stopped because of its configured stop date, or because the daemon is shutting down. | Check the stop date if this is unexpected. |
INITIALIZE_FAILED |
Could not be initialized because the metadata access store was unavailable. | Check the metadata access store, then restart the connector. |
CONFIG_FAILED |
Could not be initialized because its class name or configuration is invalid. | Correct its connection, then restart it. |
FAILED |
Threw an exception; it is not called again until restarted. | Look in the audit log for the exception, fix the cause, then restart. |
SHUTDOWN |
No longer called, because it was removed or replaced. | Nothing. |
Here is the report for one connector from qs-integration-daemon:
{
  "connectorId": "0e29b0a8-0535-4be0-8941-f8ef2af3dc3b",
  "connectorName": "MSSQLServerCataloguer",
  "connectorInstanceId": "18425ffc-804d-4846-89df-d9f65da2a949",
  "connectorStatus": "WAITING",
  "lastStatusChange": "2026-11-10T11:11:28.623+00:00",
  "lastRefreshTime": "2026-11-10T11:11:28.623+00:00",
  "minMinutesBetweenRefresh": 60
}
Refresh and restart
Refresh calls the connector's refresh() method now, without waiting for the next scheduled refresh. Use it when you know something has changed in the third party technology. Restart disconnects the connector, builds a new instance and starts it - use it to recover a FAILED connector or to pick up a corrected connection. Both can be issued for one connector or for every connector in the daemon, from the portal, hey_egeria_ops tell integration-daemon refresh|restart, RuntimeManager.refresh_integration_connector() / restart_connector(), or POST .../integration-daemons/{serverGUID}/integration-connectors/refresh|restart.
Tuning the refresh interval
The refreshTimeInterval property on the RegisteredIntegrationConnector relationship sets the number of minutes between refreshes. The daemon checks each connector every second and calls refresh() once the interval has passed since the last refresh finished.
- 0 (the default) means the connector is refreshed once when it starts, and after that only when asked to - by a refresh request, or by a change to its configuration. This suits connectors that are driven by events (such as the OpenLineage and Kafka-based connectors) or that should only run on demand.
- A positive value suits connectors that poll the third party technology. Choose it from how quickly changes need to appear in open metadata and how much load each refresh puts on the technology: a full survey of a large database server every 5 minutes may cost more than it is worth, while a daily refresh may leave the catalog a day out of date.
Because the interval belongs to the registration, not the connector, the same connector definition can be registered in two integration groups with different intervals - for example, a frequent refresh in a development daemon and a nightly one in production.
Other registration properties
| Property | Effect |
|---|---|
connectorName |
The name used in status reports, audit log messages and refresh/restart requests. |
connectorUserId |
The user the connector runs as. Defaults to the integration daemon's own user. Give a connector its own user to control what it may change, and to make its changes easy to identify. |
startDate / connectorShutdownDate |
The window in which the connector runs. Outside it the connector is not refreshed. Use these to schedule a connector for a migration window, or to retire one without deleting its definition. |
permittedSynchronization |
The direction metadata may flow: FROM_THIRD_PARTY, TO_THIRD_PARTY or BOTH_DIRECTIONS. This is the default for each of the connector's catalog targets. |
metadataSourceQualifiedName |
The software capability recorded as the source of the metadata the connector creates, which gives that metadata external source provenance. |
generateConnectorActivityReports |
Whether the connector writes connector activity reports to open metadata after each refresh. |
Changing connectorUserId, the start or stop dates, the interval or the synchronization direction takes effect on the running connector. Changing whether it uses blocking calls, or replacing its connection, makes the daemon build a new instance of the connector.
Tuning catalog targets
A catalog target attaches one piece of technology - typically the asset for a server, database or folder - to a connector. One connector can have many catalog targets, and each one carries its own settings on the CatalogTarget relationship:
| Property | Effect |
|---|---|
catalogTargetName |
Which of the connector's supported catalog target types this target is. It must match a name the connector declares. |
configurationProperties |
Settings for this target only. They are laid over the connector's own configuration properties, so one connector can, for example, include different schemas from each database it catalogs. |
templates |
Templates to use when creating elements for this target, keyed by the names the connector expects. |
metadataSourceQualifiedName |
The metadata collection that the elements created from this target belong to - so metadata from the sales database and the finance database can be kept apart. |
connectionName |
Which connection to use when the target asset has more than one. |
permittedSynchronization |
The direction metadata may flow for this target. When it is not set, the connector's value is used. |
deleteMethod |
What to do with open metadata for things removed from the technology - archive, soft-delete or purge. See Deleting metadata. |
The configuration properties a connector understands are listed on its page in the connector catalog. Here is a catalog target being added through Asset Maker:
###
# @name addCatalogTarget
POST {{baseURL}}/servers/{{viewServer}}/api/open-metadata/asset-maker/integration-connectors/{{integrationConnectorGUID}}/catalog-targets/{{metadataElementGUID}}
Authorization: Bearer {{token}}
Content-Type: application/json

{
  "class" : "NewRelationshipRequestBody",
  "properties": {
    "class": "CatalogTargetProperties",
    "catalogTargetName" : "postgreSQLDatabaseServer",
    "configurationProperties" : {
      "includeDatabaseList" : ["sales", "finance"]
    },
    "permittedSynchronization" : "FROM_THIRD_PARTY"
  }
}
The same change can be made with hey_egeria_ops tell integration-daemon add-target, with AssetMaker.add_catalog_target() in pyegeria, or with Dr.Egeria. update-target / update_catalog_target() change an existing target, and remove-target / remove_catalog_target() remove one.
When changes take effect
sequenceDiagram
    participant Op as Operator
    participant MAS as Metadata Access Store
    participant ID as Integration Daemon
    participant C as Integration Connector
    Op->>MAS: add/update CatalogTarget or RegisteredIntegrationConnector
    MAS-->>ID: change event (via the event bus)
    ID->>MAS: re-read the connector's registration
    alt connection or blocking-calls setting changed
        ID->>C: disconnect, build a new instance, start
    else anything else
        ID->>C: refresh()
        C->>MAS: read current catalog targets
        C->>C: start processors for new targets,<br/>restart changed ones, stop removed ones
    end
Figure 5: How a change to a connector's open metadata reaches the running connector
When Egeria has an event bus, the daemon hears about a change to a catalog target or registration within moments and refreshes the connector straight away. If a refresh is already in progress, the change is held until it finishes, so two instances of the connector never work on the same metadata at once. Without an event bus, the daemon re-reads each integration group's configuration roughly every half hour; issue a refresh to pick a change up sooner.
Temporary changes through Runtime Manager
Runtime Manager can also change a running connector directly: update_connector_configuration() (configuration properties), update_endpoint_address() and update_connector_connection(), or the matching .../integration-connectors/{connectorName}/... REST calls. These restart the connector with the new values in memory only - they are lost when the integration daemon restarts. They are useful for trying out a setting; make the lasting change to the connector's connection or catalog target once you are happy with it.
Usage
Treat the connector's open metadata as the configuration: add catalog targets to bring new technology under management, set the refresh interval on the registration, and keep per-target settings on the catalog target. Use refresh and restart to act on the running connector now, and the temporary Runtime Manager changes only to experiment.
Operating governance engines
An engine host runs governance engines, whose definitions - like integration groups - are held in open metadata. Engines do their work as engine actions, which are created by people, by governance action processes and by other services.
| Task | Portal | hey_egeria | pyegeria | REST |
|---|---|---|---|---|
| Engine status | Governance Engines tab | show engines status |
RuntimeManager.get_server_report() |
Runtime Manager .../omag-servers/{serverGUID}/instance/report |
| Reload engine configuration | Governance Engines tab | tell engine-host refresh |
RuntimeManager.refresh_gov_eng_config() |
Runtime Manager GET .../engine-hosts/{serverGUID}/governance-engines/refresh-config |
| Active engine actions | Engine Actions tab | show engines current-activity |
AutomatedCuration |
Automated Curation GET .../engine-actions/active |
| Cancel an engine action | Engine Actions tab | - | AutomatedCuration |
Automated Curation POST .../engine-actions/{engineActionGUID}/cancel |
An engine host normally picks up changes to its engine definitions by itself. Reloading the configuration is useful after the metadata access store has been unavailable, particularly while the engine host was starting.
Further information
- Monitoring and Tuning Guide - the audit log, Kafka and PostgreSQL, backups and housekeeping.
- Diagnostic Guide - finding out why something is not working.
- OMAG Server Runtime - running a single server in its own process.
- Administration Guide - creating and changing server configuration.
Raise an issue or comment below